At a VMUG a couple of months ago I bumped into my old friend Dennis Zimmer. Dennis told me that he was working on something cool for vSAN but couldn't reveal what it was just yet. Last week I had a call with Dennis about what that thing was. Dennis is the CEO for Opvizor, and some of you may recall the different tooling that Opvizor has produced over the years, of which the Health Analyzer was probably the most famous one back then. I've used it in the past on various occasions and I had various customers using it. During the briefing, Dennis explained to me that Opvizor started focussing on performance monitoring and analytics a while ago as the health analyzer market was overly crowded and had the issue that is was a one-off business (checks once in a while instead of daily use). On top of that, many products now come with some form of health analysis included. (See vSAN for instance.) I have to agree with Dennis, so this pivot towards Performance Monitoring makes much sense to me.
Dennis explained to me how they are seeing more and more customer demand for vSAN performance monitoring especially combined with VMware ESXi, VM and App data. Although vCenter has various metrics, and there's VROps, he told me that Opvizor has many customers who need more than vCenter or vROPS standard has to offer today and don't own VROps advanced. This is where Opvizor Performance Analyzer comes in to play and that is why today Opvizor announced they are including vSAN specific dashboards. Now, this isn't just for vSAN of course. Opvizor Performance Analyzer includes not just vSAN but also vSphere and various other parts of the stack. When talking with Dennis one thing became clear, Opvizor is taking a different approach than most other solutions. Where most focus on simplifying, hiding, and aggregating, the focus for Opvizor is on providing as much relevant detail as possible to fulfill the needs of beginner and professional.
So how does it work? Opvizor provides a virtual appliance. You simply deploy it in your environment and connect it to vCenter and you are ready to go. The appliance collects data every 5 minutes (but 20 seconds intervals of these 5 minutes) and has a retention of up to 5 years. As I said, the focus is on infrastructure statistics and performance analytics and as such Opvizor delivers all the data you ever need.
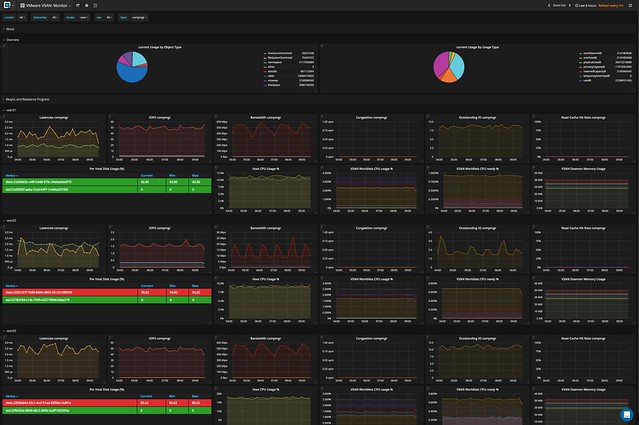
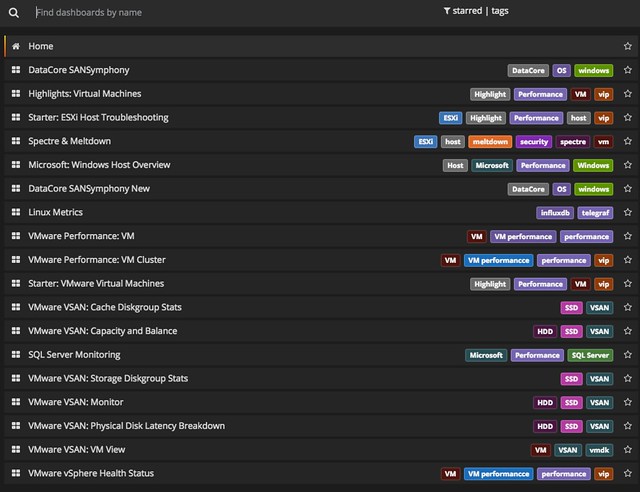
It doesn't just provide you with all the info you will ever need. It will also allow you to overlay different metrics, which makes performance troubleshooting a lot easier, and will allow you to correlate and pinpoint particular problems. Opvizor comes with dashboards for various aspects, here are the ones included in the upcoming release for vSAN:
- Capacity and Balance
- Storage Diskgroup Stats
- VM View
- Physical disk latency breakdown
- Cache Diskgroup stats
- vSAN Monitor
Now I said this is the expert´s troubleshooting tool, but Opvizor Performance Analyzer also provided in-depth information about what each metric is / means and provides starter dashboards for beginners. You can simply click on the "i" in the top left corner of the widget and you get all the info about that particular widget.
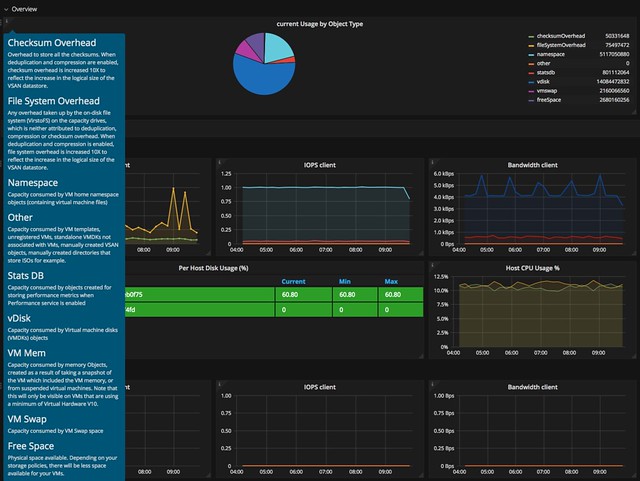
When you do know what you are looking for you can click, hover, and zoom when needed. Hover over the specific section in the graph and the point in time values of the metrics will pop up. In the case below I was drilling down on a VM in the vSAN cluster and looking at write latency in specific. As you can see we have 3 objects and in particular 2 disks and a "vm name space".

And this is just a random example, there are many metrics to look at and many different widgets and overviews. Just to give you an idea, here are some of the metrics you can find in the UI:
- Latency (for all different components of the stack)
- IOPs (for all different components of the stack)
- Bandwidth (for all different components of the stack)
- Congestion (for all different components of the stack)
- Outstanding I/O (for all different components of the stack)
- Read Cache Hit rate (for all different components of the stack)\
- ESXi vSAN host disk usage
- ESXi vSAN host cpu usage
- Number of Components
- Disk Usage
- Cache Usage
And there;s much more, too many to list in this blog. And again, not just vSAN, but there are many dashboards to chose from. If you don't have a performance monitoring solution yet and you are evaluating solutions like SolarWinds, Turbunomics and others make sure to add Opvizor to that list. One thing I have to say, I spotted a couple of things that I liked to see changed, and I think within 24hrs the Opvizor guys managed to incorporate the feedback. That was a crazy fast turnaround, good to see how receptive they are.
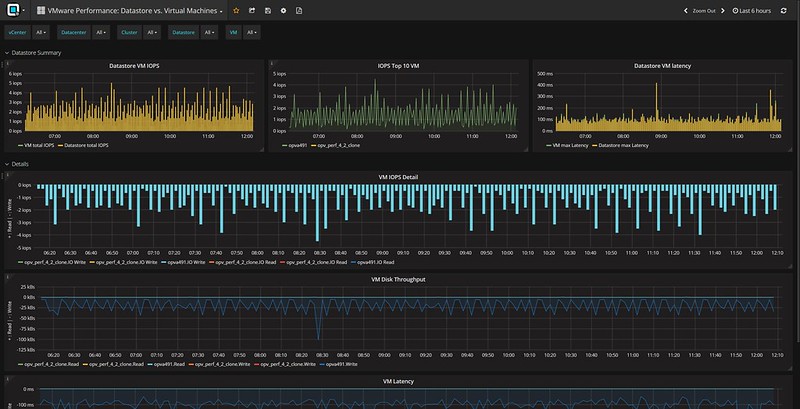
Oh, one more thing I found in the interface, it is these dashboards that deal with things like NUMA. But also things like the Top 10 VMs in terms of IOPS. Both very useful, especially when doing deep performance troubleshooting and optimizing.
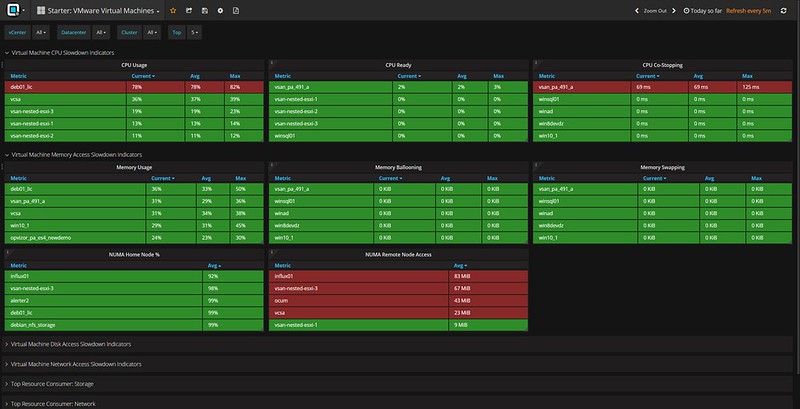
I hope that gives you a sense of what they can do. There's a fully functional 30-day trial, check it out if you want to find out more about Performance Analyzer or simply just want to play around with it. Opvizor announced this brand new version on their own blog here, make sure to give that a read as well!
The post Opvizor Performance Analyzer for vSAN appeared first on Yellow Bricks.
Original Article: http://feedproxy.google.com/~r/YellowBricks/~3/_XMDj-PhLAg/
